
Review of the Fun from 2016
One year as passed, now is the time to look back at my activity for 2016, explore some stats and take some blogging resolutions for 2017. This post was inspired by Simon Leather’s roundabout review of the year, especially the stats part.
Looking back:
In 2016 I posted 9 articles which is pretty similar to 2015 (11 articles), but is rather infrequent for a blog. Part of this can be explained by the nice opportunity that arose in late 2015 to post regular R tutorials directly at data science plus I was really happy to contribute to this and be part of a really diverse team of writer. Some posts over there were pretty successful like this one or this one. In March I decided to spent again some time for this blog and to be frank I did not have that many ideas for R tutorials any more. Around that time I also started to write my PhD thesis which left me with limited motivation to spend some extra time writing blog posts. Later on, in May, some inspiration came back and between May and December I posted once per month.
Some stats:
Of the 9 articles posted in 2016, two were purely about ecological themes, three (my favourites) were presenting some simple ecological models and simulated in R their dynamics and four were looking like R tutorials but were pretty specialized. Of the nine articles published this year the one with most views was the post where I showed how to fit simple hierarchical models with Rstan. In terms of overall views this article was the 8th most visited article this year with 591 views, well behind the two top posts: GLMM for ecologists and a post on interpreting interaction coefficients each one having more than 3’000 views. Looking at the temporal dynamic of number of monthly views over the last three years, we see an increase up to mid-2015, a decline up to mid-2016 and an increase until December 2016.
[caption id=”attachment_1600” align=”alignnone” width=”657”]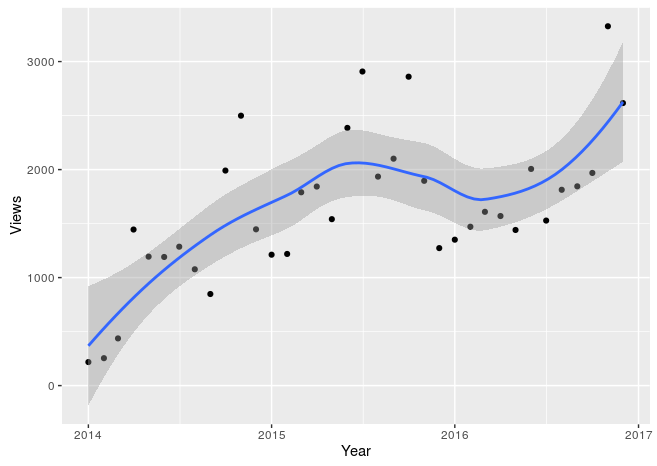 Number of monthly views with a fitted smoothed curve.[/caption]
I guess that this is reflecting pretty well the fact that I stopped posting between November 2015 and May 2016, so blog views increase only if new materials is regularly posted (no way!). Let’s go further and look at how these views were distributed between the posts, Rank-Abundance Distribution are a great way to visualize this.
[caption id=”attachment_1608” align=”alignnone” width=”657”]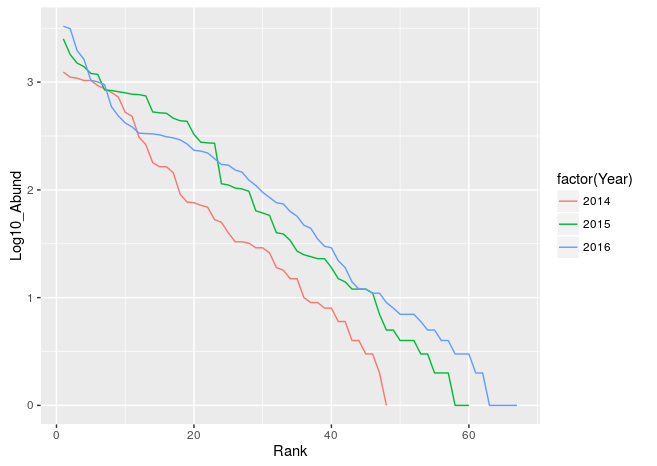 Rank-Abundance Distribution on the x-axis are the post ranks from most viewed (1) up to least viewed, on the y-axis is the log10 of the number of views. If all posts were to get the same number of views we would get an horizontal line.[/caption]
In this graph we see the increase in proportion of views for the most read posts in 2016 compared to 2015 and 2014. Basically a third of all views were on only two posts out of the ~70 posts in 2016. It seems that successful post become more successful over time, thank you Google Bots. Finally, wordpress also gives me the number of views per country, 147 countries represented in 2016. Let’s look at the proportion of views (within years) coming from the top10 countries.
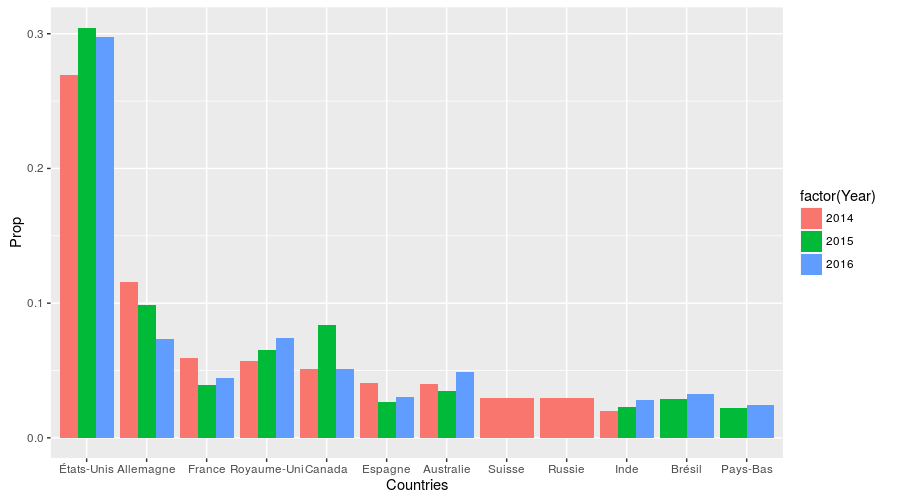
Around a third of the views come from the US and it stayed rather constant between 2014 and 2016. One out of 10 views was from Germany in 2014, this proportion dropped to one out of 20 in 2016. At the same time the proportion of views from the UK kept rising. Readership on this blog is mostly from western countries, but I am always pretty happy when I see some connexions from countries I was not aware of like Guam, Malawi or Macao Special Administrative Region of the People’s Republic of China.
Resolutions for 2017:
Most of the readers come to this blog interested by R stuff. I do have a lot of fun writing these posts and it is always a challenge to explain (complex) concepts. For instance, you think that you know what an interaction term is but then you realize that you do not really know how to convey your (vague) understanding, to explain you need to develop your own understanding. All this to say that I will continue posting R-related posts but I intend to have more and more posts about what I actually do (ecology) and maybe some advice posts for students and PhDs. I am also thinking in re-designing a bit the homepage, moving more towards a professional website like this one and to post a bit more regularly, like twice a month. Thanks for reading, thanks for commenting, it is always satisfying to hear that the stuff I write are actually useful to some. Happy 2017!

Leave a Comment