
Simulating SEMs for piecewiseSEM: part 1 the basics
Structural Equation Models are being used more and more frequently by ecologists due to the appeal of linking variables together in complex web of interactions. There are currently two main libraries in R to fit such models: lavaan and piecewiseSEM. The aim of this post is not to discuss the advantages and drawbacks of these two libraries, the interested reader can have a look at this post.
Rather the aim of this post is to simulate relations among a set of variables, to generate some data with random relations and to fit the relation to the data using piecewiseSEM. All the code can be found here.
I just want to disclaim here that I am skeptical of the piecewiseSEM approach. Because one accept the model when the (linear) relations not fitted by the models are not important (in jargon: all variables are conditionally independent). I like to compare the approach of piecewiseSEM to hand stencils : we are interested to make a model for the hand. But we do not actually test the model to see if it fits the image of the hand itself but rather the pigment halo surrounding it. Maybe this is ok and actually better in some cases than lavaan but until I am convinced otherwise I will keep my skepticism.
Rationale
One key insight is to see SEMs as a specific class of graphs. We have nodes (the variables) and we have edges (the relations/regressions). piecewiseSEM requires that the graphs be acyclic, which means that if we start at one node there is no way to come back to this node. If we see the graph (the SEM model) as a matrix of _variables x variables _and each entry can either be 0 meaning no relation and 1 meaning relation, an acyclic graph will have ones only in the lower triangle. (a bit more complex than this but for now this’ll do). Of course the diagonal will only contain 0s, we do not want to model the effect of variable X1 on variable X1.
Now we can generate a matrix and be sure that it will be acyclic so that we can fit the model with piecewiseSEM. But how many 1s should we put in the matrix? There I use another concept from graph theory which is the connectance computed as the number of edges divided by the number of nodes squared. If we want to build a SEM with a specific connectance we can get the number of links to model.
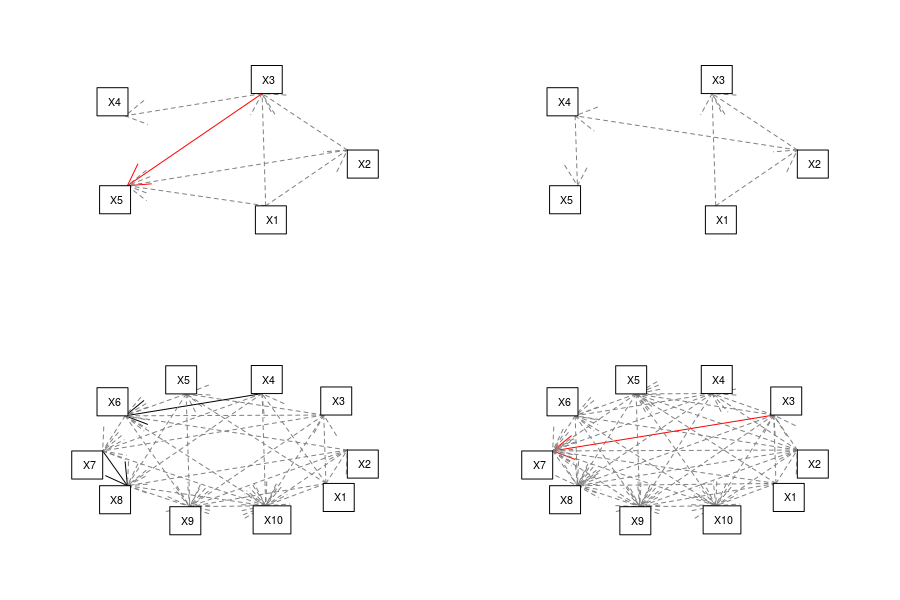
Armed with this we can build matrix representing the hypothesized relations (function relation in the code), turn this into a list of models (function formula_list and model_list in the code) and fit a piecewiseSEM. As an example here are four SEMs with varying number of variables and connectance created by the code:
Results
In a first step I generated data with no relations, one could of course in a later step try generating the data with the exact relation or slightly different relations. I then fitted piecewiseSEM with variation in the sample size (from 20 to 100) and in the number of variables (from 5 to 10) while keeping the connectance fixed at 0.3. This connectance value means that we fit 7 paths for 5 variables and 30 paths for 10 variables. This was replicated many times for each combination of sample size and number of variables (100 times) and I tracked if the model was estimated to be consistent with the data or not (if the Fisher C p-value was higher than 0.05), how many paths were significant and what was the average value of significant paths.
Here are the results for the proportion of times a model was estimated consistent:
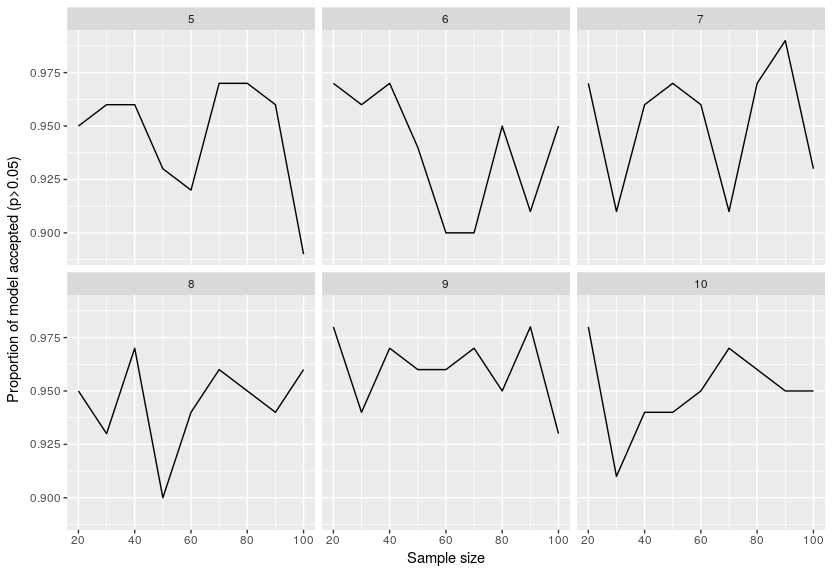
This is super surprising around 95% of the models were said to be consistent with the data even if they just fitted noise. I re-checked the original publication on piecewiseSEM to see if I incorrectly inverted the threshold but no, that was not the case … I will try and see if lavaan is as wrong in this case.
Now let’s look at the proportion of paths estimated to be significant:
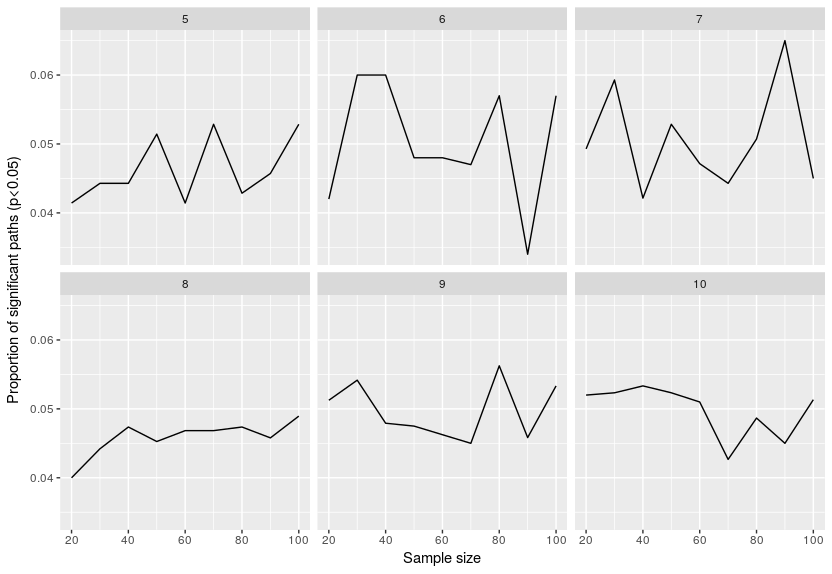
This is better, around 5% of the paths are estimated to be significant, which is what is expected. In other words even your dataset is only noise (no relation between the variables), in 5% of the cases you will assume a relation that does not exist. That is the curse of using significance thresholds. The issue with SEMs is that we are fitting so many relations that it is certain that you will end up with some significant relations, don’t know if one can adjust p-values in SEM for multiple testing issues …
Finally I look at the average value of the significant paths:
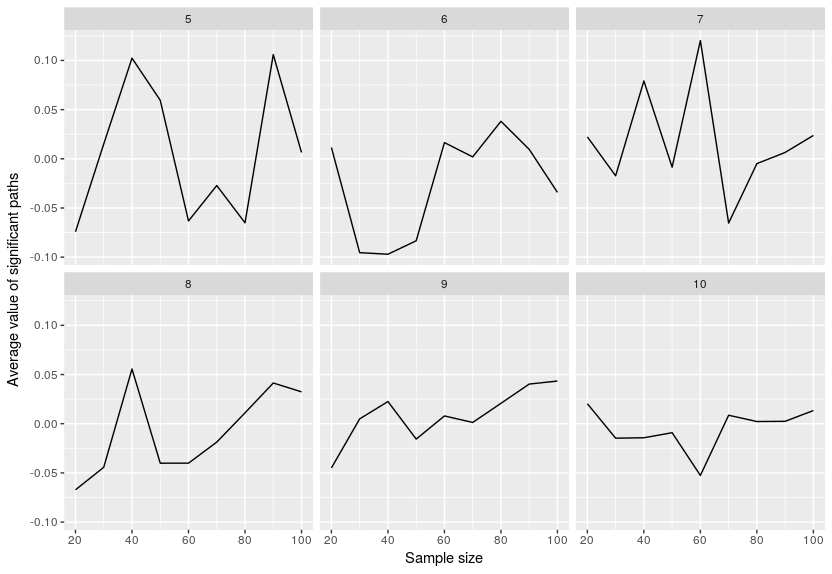
Not much to say here, the values are usually on average around 0 which is to be expected since we just had noise.
Conclusion
piecewiseSEM seems to accept many models that are just noise and because one fits many models one will certainly end up with some significant relations that could always be explained post-hoc. Of course this was just a small exercise and this should be expanded and compared to lavaan or other algorithms.
Wishing you Happy but Careful modeling.

Leave a Comment