Exploring the diversity of Life using Rvest and the Catalog of Life
I am writing the general introduction for my thesis and wanted to have a nice illustration of the diversity of Arthropods compared to other phyla (my work focus on Arthropods so this is a nice motivation). As the literature I have had access so far use pie charts to graphically represent these diversities and knowing that pie chart are bad, I decided to create my own illustration.
Fortunately I came across the Catalogue of Life website which provide (among other things) an overview of the number of species in each phylum. So I decided to try and have a go at directly importing the data from the website into R using the rvest package.
Let’s go:
#load the packages
library(rvest)
library(ggplot2)
library(scales)#for comma separator in ggplot2 axis

#read the data
col<-read_html("http://www.catalogueoflife.org/col/info/totals")
col%>%
  html_table(header=TRUE)->sp_list
sp_list<-sp_list[[1]]
#some minor data re-formatting
#re-format the data frame keeping only animals, plants and
#fungi
sp_list<-sp_list[c(3:37,90:94,98:105),-4]
#add a kingdom column
sp_list$kingdom<-rep(c("Animalia","Fungi","Plantae"),times=c(35,5,8))
#remove the nasty commas and turn into numeric
sp_list[,2]<-as.numeric(gsub(",","",sp_list[,2]))
sp_list[,3]<-as.numeric(gsub(",","",sp_list[,3]))
names(sp_list)[2:3]<-c("Nb_Species_Col","Nb_Species")
Now we are read to make the first plot
ggplot(sp_list,aes(x=Taxon,y=Nb_Species,fill=kingdom))+
 geom_bar(stat="identity")+
 coord_flip()+
 scale_fill_discrete(name="Kingdom")+
 labs(y="Number of Species",x="",title="The diversity of life")

This is a bit overwhelming, half of the phyla have less than 1000 species so let’s make a second graph only with the phyla comprising more than 1000 species. And just to make things nicer I sort the phyla by the number of species:
subs<-subset(sp_list,Nb_Species>1000)
subs$Taxon<-factor(subs$Taxon,levels=subs$Taxon[order(subs$Nb_Species)])
ggplot(subs,aes(x=Taxon,y=Nb_Species,fill=kingdom))+
 geom_bar(stat="identity")+
 theme(panel.border=element_rect(linetype="dashed",color="black",fill=NA),
 panel.background=element_rect(fill="white"),
 panel.grid.major.x=element_line(linetype="dotted",color="black"))+
 coord_flip()+
 scale_fill_discrete(name="Kingdom")+
 labs(y="Number of Species",x="",
 title="The diversity of multicellular organisms from the Catalog of Life")+
 scale_y_continuous(expand=c(0,0),limits=c(0,1250000),labels=comma)

That’s it for a first exploration of the powers of rvest, this was actually super easy I expected to have to spend much more time trying to decipher xml code, but rvest seems to know its way around …
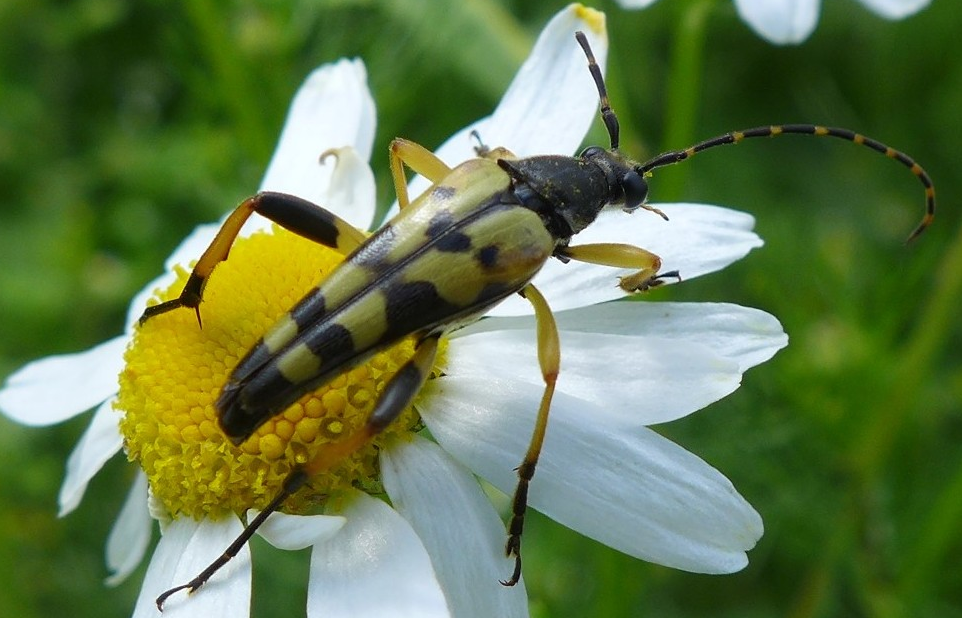
This graph is also a nice reminder that most of the described multicellular species out there are small crawling beetles and that we still know alarmingly very little about their ecology and status of threat. As a comparison all the vertebrates (all birds, mammals, reptiles, fishes and some other taxa) are within the Chordata and having a total of 50,000 described species. An even more sobering thought is the fact that the total number of described species is only a fraction of what is left undescribed.


Leave a Comment