Generalized Linear Mixed Models in Ecology and in R
I had a nice workshop two weeks ago in Tübingen (south-germany) concerning Generalized Linear Mixed Models (GLMM) in R. The course was given by two ecologist: Dr. Pius and Fränzi Korner-Nievergelt that spend now half of their time doing statistical consulting (http://www.oikostat.ch/navigation_engl.htm). Nice reference concerning GLMMs are: the 2009 Bolker paper (paper), the 2007 book by Gelman (book1) and the 2009 Zuur mixed effect book (book2)
The course was very nice starting from basic linear models to more complex modelling techniques like GLMM, the teachers are also among the growing (tiny) number of ecologists that are trying out and applying bayesian data analysis to their dataset for theoretical as well as practical reasons (some complex model structure can only be fitted within a Bayesian framework).
I will most certainly need a few years to fully digest and apply what I learned and saw there, but I also had to make a small workshop for my working group to spread the knowledge gained. So this post is just to give around the R script I used to show how to fit GLMM, how to assess GLMM assumptions, when to choose between fixed and mixed effect models, how to do model selection in GLMM, and how to draw inference from GLMM.
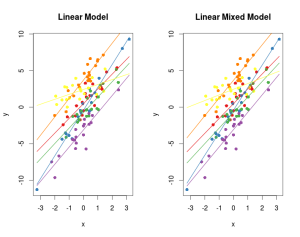
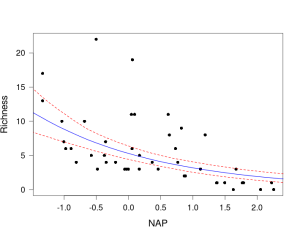
As a teaser here are two cool graphs that you can do with this code:
#####################################################################
# R script use for the GLMM mini-Workshop on 11th March in Freising #
#       Author: Lionel Hertzog and Franzi Korner-Nievergelt         #
#####################################################################


#load the libraries
library(lme4)
library(nlme)
library(arm)
library(RCurl)#to directly download the rikz dataset

########################
# part 0 fitting GLMM #
 #  #  #  #  #  #  #

#the example dataset we will use
rikz_link<-getURL("https://raw.githubusercontent.com/ranalytics/r-tutorials/master/Edition_2015/Data/RIKZ.txt")
data<-read.table(textConnection(rikz_link),head=TRUE,sep="\t",stringsAsFactors = FALSE)
#first a random intercept model
mod_lme1<-lme(Richness~NAP,data=data,random=~1|Beach)
mod_lmer1<-lmer(Richness~NAP+(1|Beach),data=data)
#then a random slope plus intercept model
mod_lme2<-lme(Richness~NAP,data=data,random=NAP|Beach)
mod_lmer2<-lmer(Richness~NAP+(NAP|Beach),data=data)
#Poisson model
mod_glmer1<-glmer(Richness~NAP+(1|Beach),data=data,family="poisson")
#nested and crossed random effect??

##################################
#   part 1 mixed vs fixed effect #
  #   #   #   #   #   #   #   #
#factor variable with intercept only effect
#simulate data in a fixed effect way
x<-rnorm(120,0,1)
f<-gl(n=6,k=20)
modmat<-model.matrix(~x+f,data.frame(x=x,f=f))
betas<-c(1,2,0.3,-3,0.5,1.2,0.8)
y<-modmat%*%betas+rnorm(120,0,1)

#the fixed effect model
m_lm<-lm(y~x+f)
#the mixed effect model
m_lme<-lme(y~x,random=~1|f)

#checking model assumptions in both case
par(mfrow=c(2,2))
plot(m_lm)

plot(fitted(m_lme),resid(m_lme))
qqnorm(resid(m_lme))
qqnorm(ranef(m_lme)[,1])
plot(x,resid(m_lme))

#looking at the fitted parameters
summary(m_lm)
summary(m_lme)

#plot the fit of the model
par(mfrow=c(1,1))
library(RColorBrewer)
pal<-brewer.pal(6,"Set1")
plot(y~x,col=pal[f],pch=16,main="Linear Model")
for(i in 1:length(levels(f))){
  if(i==1){
    lines(x,coef(m_lm)[1]+coef(m_lm)[2]*x,col=pal[i],lwd=1.5)
  }
  else{
    lines(x,coef(m_lm)[1]+coef(m_lm)[2]*x+coef(m_lm)[i+1],col=pal[i],lwd=1.5)
  }
}

plot(y~x,col=pal[f],pch=16,main="Linear Mixed Model")
for(i in 1:length(levels(f))){
 lines(x,fixef(m_lme)[1]+fixef(m_lme)[2]*x+ranef(m_lme)[i,1],col=pal[i],lwd=1.5)
}
#no clear difference visible

#now generqte a random slope/intercept model through the mixed effect technique
rnd.eff<-rnorm(5,0,2)
slp.eff<-rnorm(5,0,1)
all.eff<-c(1,2,rnd.eff,slp.eff)
modmat<-model.matrix(~x*f,data.frame(x=x,f=f))
y<-modmat%*%all.eff+rnorm(120,0,1)

#build the two model
m_lm2<-lm(y~x*f)
m_lme2<-lme(y~x,random=~x|f)

#checking model assumptions
par(mfrow=c(2,2))
plot(m_lm2)
plot(fitted(m_lme2),resid(m_lme2))
abline(h=0,lty=2,col="red")
qqnorm(resid(m_lme2))
qqnorm(ranef(m_lme2)[,1])
qqnorm(ranef(m_lme2)[,2])

#summary of the models
summary(m_lm2)
summary(m_lme2)

#plot the model fitted values
par(mfrow=c(1,2))
plot(y~x,col=pal[f],pch=16,main="Linear Model")
for(i in 1:length(levels(f))){
  if(i==1){
    lines(x,coef(m_lm2)[1]+coef(m_lm2)[2]*x,col=pal[i],lwd=1.5)
  }
  else{
    lines(x,coef(m_lm2)[1]+(coef(m_lm2)[2]+coef(m_lm2)[i+6])*x+coef(m_lm2)[i+1],col=pal[i],lwd=1.5)
  }
}

plot(y~x,col=pal[f],pch=16,main="Linear Mixed Model")
for(i in 1:length(levels(f))){
  lines(x,fixef(m_lme2)[1]+(fixef(m_lme2)[2]+ranef(m_lme2)[i,2])*x+ranef(m_lme2)[i,1],col=pal[i],lwd=1.5)
}

#again no clear difference can be seen ...

#conclusion
#end of Practical 1

#######################
#   Practical 2      #
  #   #   #   #   #

#checking model assumptions
par(mfrow=c(2,2))
plot(fitted(m_lme2),resid(m_lme2))
abline(h=0,lty=2,col="red")
qqnorm(resid(m_lme2))
qqline(resid(m_lme2))
qqnorm(ranef(m_lme2)[,1])
qqline(ranef(m_lme2)[,1])
qqnorm(ranef(m_lme2)[,2])
qqline(ranef(m_lme2)[,2])
scatter.smooth(fitted(m_lme2),sqrt(abs(resid(m_lme2))))

#wrong data
modmat[,2]<-log(modmat[,2]+10)
y<-modmat%*%all.eff+runif(120,0,5)
m_wrg<-lme(y~x,random=~x|f)

plot(fitted(m_wrg),resid(m_wrg))
abline(h=0,lty=2,col="red")
qqnorm(resid(m_wrg))
qqline(resid(m_wrg))
qqnorm(ranef(m_wrg)[,1])
qqline(ranef(m_wrg)[,1])
qqnorm(ranef(m_wrg)[,2])
qqline(ranef(m_wrg)[,2])
scatter.smooth(fitted(m_wrg),sqrt(abs(resid(m_wrg))))

#plot fitted values vs resid, qqnorm the residuals and all random effects

#end of practical 2

###################
#  Practical 3   #
 #  #  #  #  #  #

#Model selection
#work with the RIKZ dataset from Zuur et al

data<-read.table("/home/lionel/Documents/PhD/GLMM_WS/data/rikz.txt",sep=" ",head=TRUE)

#testing the random effect
#a first model
mod1<-lme(Richness~NAP+Exposure,data=data,random=~1|Beach,method="REML")
#a second model without the random term, gls is used because it also fit the model through REML
mod2<-gls(Richness~NAP+Exposure,data=data,method="REML")
#likelihood ratio test, not very precise for low sample size
anova(mod1,mod2)

# parameteric bootstrap
lrt.obs <- anova(mod1, mod2)$L.Ratio[2] # save the observed likelihood ratio test statistic
n.sim <- 1000  # use 1000 for a real data analysis
lrt.sim <- numeric(n.sim)
dattemp <- data
for(i in 1:n.sim){
  dattemp$ysim <- simulate(lm(Richness ~ NAP+Exposure, data=dattemp))$sim_1 # simulate new observations from the null-model
  modnullsim <- gls(ysim ~ NAP+Exposure, data=dattemp)   # fit the null-model
  modaltsim <-lme(ysim ~ NAP+Exposure, random=~1|Beach, data=dattemp)  # fit the alternative model
  lrt.sim[i] <- anova(modnullsim, modaltsim)$L.Ratio[2] # save the likelihood ratio test statistic
}

(sum(lrt.sim>=lrt.obs)+1)/(n.sim+1)  # p-value

#plot
par(mfrow=c(1,1))
hist(lrt.sim, xlim=c(0, max(c(lrt.sim, lrt.obs))), col="blue", xlab="likelihood ratio test statistic", ylab="density", cex.lab=1.5, cex.axis=1.2)
abline(v=lrt.obs, col="orange", lwd=3)

#model selection for the fixed effect part, to use the simulate function we need MER object
mod1_ML<-lme(Richness~NAP+Exposure,data,random=~1|Beach,method="ML")
mod3<-lme(Richness~NAP,data,random=~1|Beach,method="ML")
mod1_lmer<-lmer(Richness~NAP+Exposure+(1|Beach),data=data,REML=FALSE)
mod3_lmer<-lmer(Richness~NAP+(1|Beach),data=data,REML=FALSE)
#compare with lme results
summary(mod1_lmer)
summary(mod1_ML)
#anova
anova(mod1_lmer,mod3_lmer)

#again parametric boostrapping of the LRT
lrt.obs<-anova(mod1_lmer, mod3_lmer)$Chisq[2]
n.sim <- 1000  # use 1000 for a real data analysis
lrt.sim <- numeric(n.sim)
dattemp <- data
for(i in 1:n.sim){
  dattemp$ysim <-  unlist(simulate(mod3_lmer)) # simulate new observations from the null-model
  modnullsim <- lmer(ysim ~ NAP+(1|Beach), data=dattemp,REML=FALSE)   # fit the null-model
  modaltsim <-lmer(ysim ~ NAP+Exposure+(1|Beach), data=dattemp,REML=FALSE)  # fit the alternative model
  lrt.sim[i] <- anova(modnullsim, modaltsim)$Chisq[2] # save the likelihood ratio test statistic
}

(sum(lrt.sim>=lrt.obs)+1)/(n.sim+1)  # p-value

#plot
hist(lrt.sim, xlim=c(0, max(c(lrt.sim, lrt.obs))), col="blue", xlab="likelihood ratio test statistic", ylab="density", cex.lab=1.5, cex.axis=1.2)
abline(v=lrt.obs, col="orange", lwd=3)

#the next step would be to drop NAP first and then see if the likelihood ratio test is significant and if dropping Exposure first always
#lead to higher LRT statistic
#other methods, AIC..
#R square computation for GLMM, see supplementary material from Nakagawa 2013 MEE
VarF <- var(as.vector(fixef(mod1_lmer) %*% t(mod1_lmer@pp$X)))
# VarCorr() extracts variance components
# attr(VarCorr(lmer.model),’sc’)^2 extracts the residual variance, VarCorr()$plot extract the variance of the plot effect
VarF/(VarF + VarCorr(mod1_lmer)$Beach[1] + attr(VarCorr(mod1_lmer), "sc")^2 )

#compute the conditionnal R-square
(VarF + VarCorr(mod1_lmer)$Beach[1])/(VarF + VarCorr(mod1_lmer)$Beach[1] + (attr(VarCorr(mod1_lmer), "sc")^2))

#end of practical 3


######################
#    Practical 4    #
 #  #  #  #  #  #  #

#drawing inference from a model
#p-values can be retrieved from lme and glmer but not from lmer call
summary(mod1)
summary(mod1_lmer)

mod1_glmer<-glmer(Richness~NAP+Exposure+(1|Beach),data=data,family="poisson")
summary(mod1_glmer)

#using sim from the arm package
n.sim<-1000
simu<-sim(mod1_glmer,n.sims=n.sim)
head(simu@fixef)
#95% credible interval
apply(simu@fixef,2,quantile,prob=c(0.025,0.5,0.975))
#plotting the effect of NAP on the richness
nsim <- 1000
bsim <- sim(mod1_glmer, n.sim=nsim)
newdat <- data.frame(NAP=seq(-1.5, 2.5, length=100),Exposure=mean(data$Exposure))
Xmat <- model.matrix(~NAP+Exposure, data=newdat)
predmat <- matrix(ncol=nsim, nrow=nrow(newdat))
predmat<-apply(bsim@fixef,1,function(x) exp(Xmat%*%x))
newdat$lower <- apply(predmat, 1, quantile, prob=0.025)
newdat$upper <- apply(predmat, 1, quantile, prob=0.975)
newdat$med<-apply(predmat, 1, quantile, prob=0.5)

plot(Richness~NAP, data=data, pch=16, las=1, cex.lab=1.4, cex.axis=1.2)
lines(newdat$NAP,newdat$med,col="blue",lty=1,lwd=1.5)
lines(newdat$NAP,newdat$upper,col="red",lty=2,lwd=1.5)
lines(newdat$NAP,newdat$lower,col="red",lty=2,lwd=1.5)

#to compare the coefficient between the different terms standardize the variable
data$stdNAP<-scale(data$NAP)
data$stdExposure<-scale(data$Exposure)
mod2_glmer<-glmer(Richness~stdNAP+stdExposure+(1|Beach),data=data,family="poisson")

#simulate to draw the posterior distribution of the coefficients
n.sim<-1000
simu<-sim(mod2_glmer,n.sims=n.sim)
head(simu@fixef)
#95% credible interval
coeff<-t(apply(simu@fixef,2,quantile,prob=c(0.025,0.5,0.975)))
#plot
plot(1:3,coeff[,2],ylim=c(-0.8,2),xaxt="n",xlab="",ylab="Estimated values")
axis(side=1,at=1:3,labels=attr(fixef(mod2_glmer),"names"))
segments(x0=1:3,y0=coeff[,1],x1=1:3,y1=coeff[,3],lend=1)
abline(h=0,lty=2,col="red")

#end of practical 4


Leave a Comment