
Patterns across 50 years of French presidential election
[Une version francaise de cette article est disponible ici]
This year (2017) we will have our presidential election between April and May in France. A while ago I discovered the open data website of the French government publishing public data with free access and promoting utilization by anyone. So in this post I will explore temporal and spatial patterns of the French presidential election using my favorite software: R. All the code and data are available here or at the end of the post.
First of all, I would like to provide a bit of context for those who are not familiar with the French presidential election and more generally French politics.
Background
The French president is directly elected by citizen since 1965. The election is made of two rounds, the two candidates with the highest number of cast votes in the first round go on to the second round, which is usually held a few weeks after the first one. The candidate with the highest number of cast votes in the second round is elected president. The president mandate was for 7 years between 1965 and 2000 after that the mandate was reduced to 5 years. To run for president one has to: be French, be older than 18 years old (21 before 2011), be electable, and have received support from , at least, 500 elected officials (member of parliament, local officials …). There are usually around 10 candidates for the first round, the minimum was 6 candidates in 1965 and the maximum was 16 in 2002. For more infos check this wiki page.
The main political movements in France are: (i) Communists and associated far left parties (Extreme gauche), (ii) Socialists, the main left-wing party (Socialiste), (iii) Smaller left wing parties (Divers Gauche), (iv) Green party (Ecologiste), (v) Different liberals and democrats parties (Centriste), (vi) Small right-wing parties (Divers Droite), (vii) The main right-wing party which changes names every second election which is rather confusing (Droite) and (viii) Populist and nationalist right-wing parties such as the national front (Extreme Droite).
Broad temporal patterns
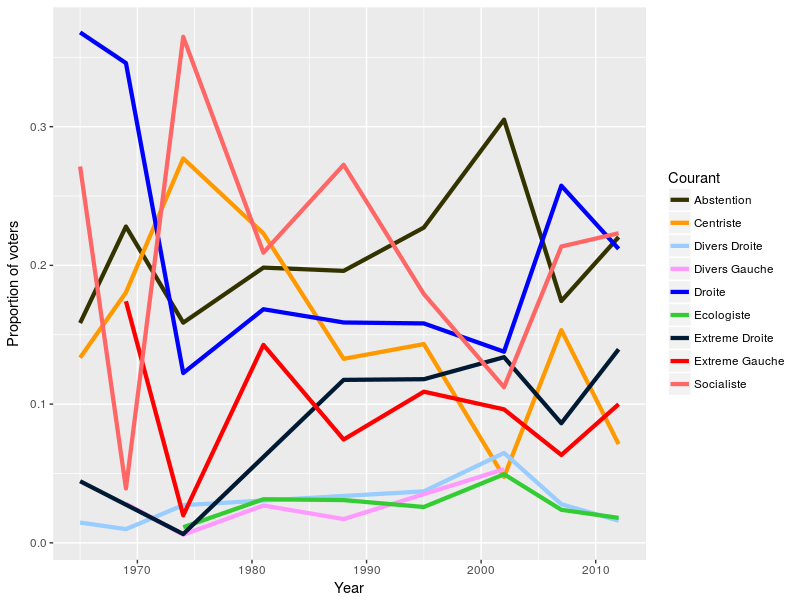
Let’s jump right in and look at the variation in proportion of votes of the different movements that I outlined above. Note that I compute the proportions in terms of potential voters and not in terms of actual voters to give a better impression of the popular backing of the different candidates. Also blank votes and abstention are lumped together as I would argue that they are both a different form of protest vote.
A couple of special elections are worth mentioning:
-
In 1969 : de Gaulle resign after a failed referendum and anticipated elections are conveyed, de Gaulle himself do not run for re-election. These election happen in the wake of the May 1968 civil unrest which explain the high proportion of Extreme Gauche votes.
-
In 1974: The president (Pompidou) dies and again anticipated elections are held. Even if the Socialist led by Mitterrand are ahead in the first round, a centrist (Giscard d’Estaing) is elected after a super tight second round (50.8 vs 49.2%).
-
In 2002: 16 candidates are present in the first round, abstention reaches a record high at 30%, the candidate from the populist national front (Le Pen) beats the socialists by 200k votes and goes to the second round. In the second round the candidate from the main right-wing party (Chirac) wins with 80% of the votes.
Some general trends emerge, for instance the Centrists and the Socialists shares have declined since the 80s despite a rebound in 2007. The Extreme Droite progressed continuously between 1974 and 2002, in 2007 the runner from the right-wing party (Sarkozy) held views that certainly appealed to some Extreme Droite voters explaining the dent in Extreme Droite votes for that election. The main right-wing party had constant proportions between 1974 and 2002 (around 15%), but this party scored super high in the 60s (above 30%) and since 2002 also got more votes. The abstention rose almost continuously over time but after the shock of 2002 and after a super heated campaign, the 2007 election saw a drop in abstention below 20%. In the last election in 2012, the socialist and the right-wing party had very similar proportion but populist votes and abstention was once again on the rise.
Spatial patterns
The original data are per county (circonscription) which in France changes very often as running majorities usually tries to move county borders to ensure their re-election. I aggregated the data at a higher level the Departements, sub-regional entities, which stayed in most cases constant over the years. I look first at the distribution of abstention votes across the elections:
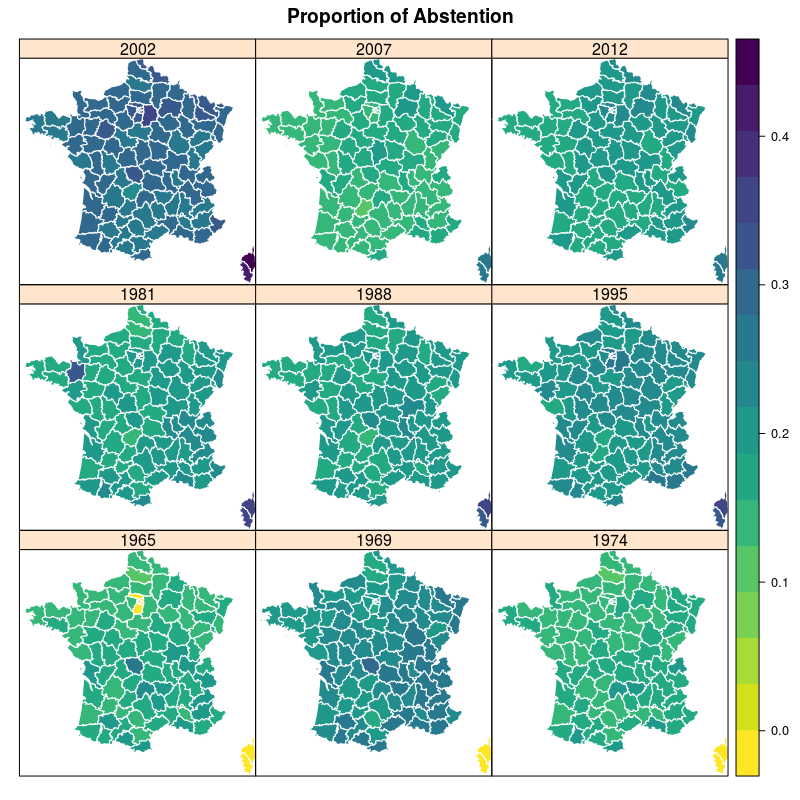
Nothing super striking there, it seems that all departements had rather similar levels of abstention. Apart from Corsica which had way higher abstention between 1981 and 2002 (note that between 1965 and 1974 Corsica administrative division was different from today). And apparently something weird happened in Ille et Vilaine (the region around Rennes in Brittany) in 1981.
We could plot this for each political movement, but I will make just another one for the Extreme Droite:
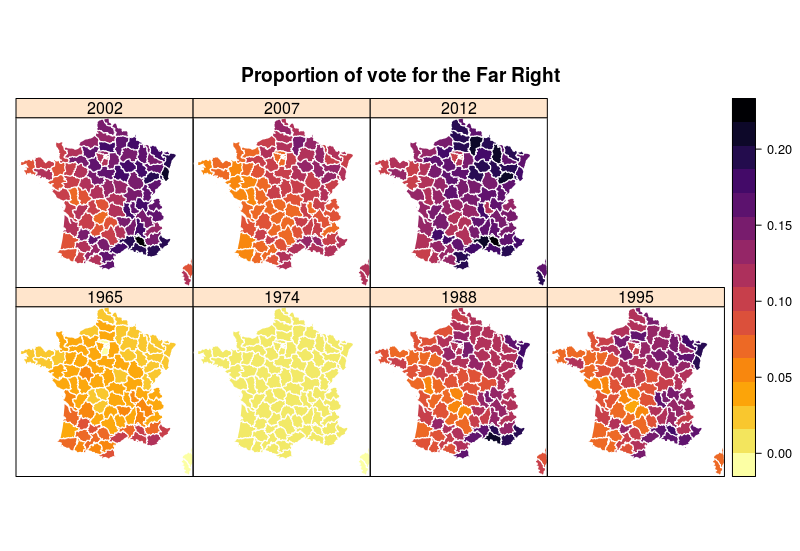
In 1965 the Extreme Droite was mostly on the Cote d’Azur on the coastline from Marseille to Nice. In 1974 Le Pen (father) founded the national front (FN) and ran for election for the first time, he got less than 1% of the votes. Only two elections after that in 1988 the FN got again large proportions in the Cote d’Azur but also in north-eastern France especially in Alsace-Moselle. In 1995 department along the Rhone valley and around Paris also started to heavily vote for Le Pen. For the 2002 election when Le Pen reached the second round all departements in the North, North-East, Center-East and South-East voted with more than 15% for Le Pen. As mentioned above, this dynamic was broken in the 2007 election but in 2012 the patterns looked similar to 2002. See this analysis which explore the links between unemployment and national front votes.
In a final plot I aggregated the data per regions and plotted the temporal trends in proportion of votes among the main political movements, which gives this:
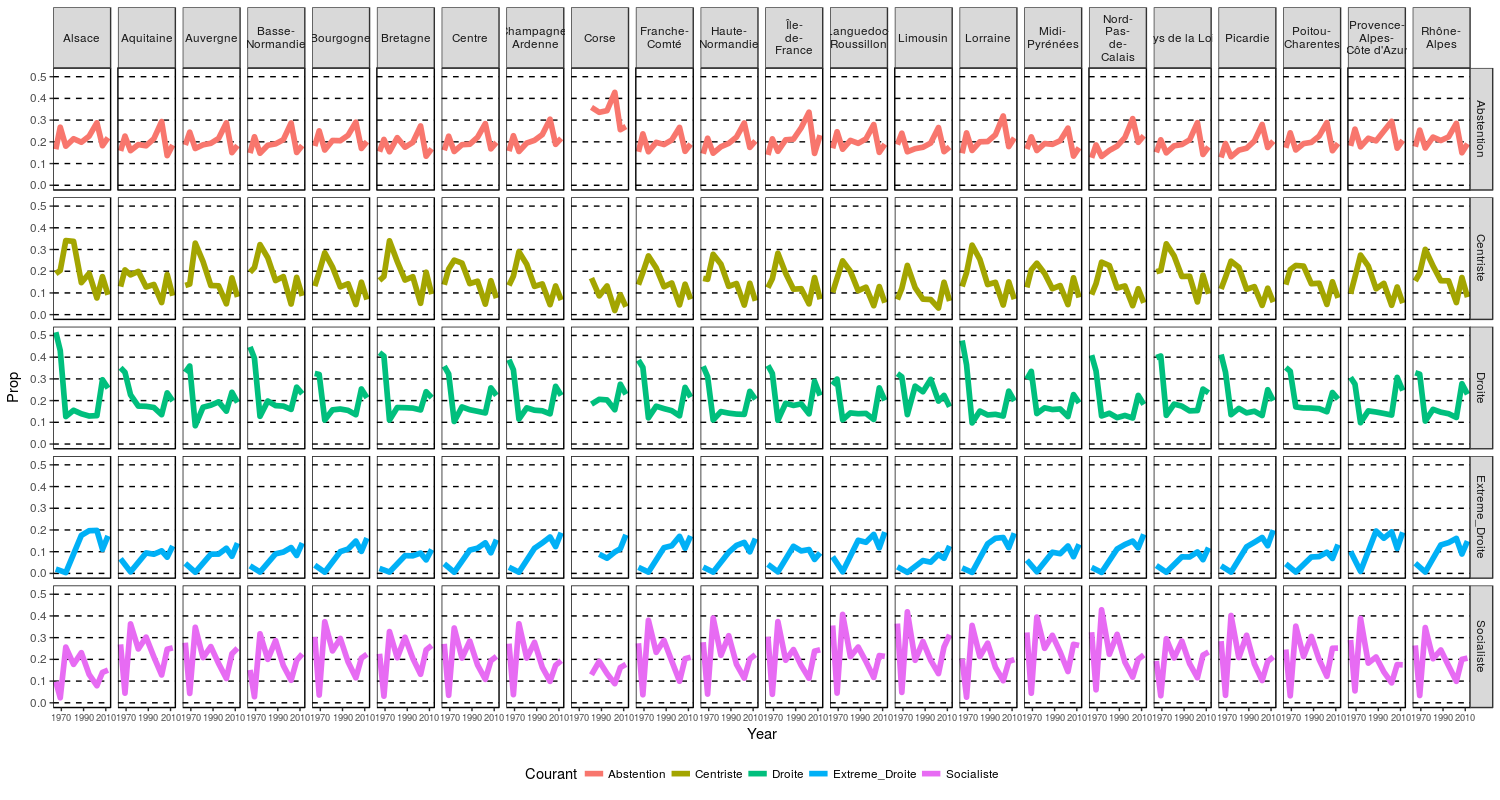
Many things could be said, I will focus on three elements:
-
Voters in Alsace were fans of de Gaulle, he got more than 50% on the first round in 1964!
-
Abstention kept increasing across all regions between 1974 and 2002, this pattern is especially visible in regions from the North and North-East like Picardie and Lorraine but also in Ile-de-France.
-
Extreme Droite votes increased across all regions, in Alsace and Provence-Alpes-Cote d’Azur some kind of plateau was reached at around 20% between 1988 and 2002.
What to expect in 2017?
Left-wing candidate are going up dispersed for the upcoming presidential election, there are already 4 declared candidates that emerged from major left-wing parties (Mélenchon, Hamon, Jadot and Macron). With at least two more from smaller parties. On the right side of the political spectrum only one candidate remain after a primary, the first of its kind, which saw Sarkozy beaten up by its former prime minister Fillon. Fillon who is currently in the midst of a corruption scandal. Le Pen (daughter) started polishing up the image of the national front for some years now, she evicted her father from the party in the process. Polls predict that she may reach the second round amid widespread disappointment of the current socialist majority and continuing fear of new terrorist attacks.
Who said that French politic was boring?
The Code:
##############################
#Exploring patterns in 40 years
#of french presidential election
###########################

#Data are fom:
#Résultats des élections présidentielles 1965-2012, PRESIDENTIELLES1965-2012.zip [fichier informatique],
#Grenoble : Banque de Données Socio-Politiques, Paris : Ministère de l’Intérieur, France [producteurs],
#Centre de Données Socio-Politiques [diffuseur], 2014.

#Original data available here: https://www.data.gouv.fr/fr/datasets/elections-presidentielles-1965-2012-1/
#Modified data used in this post available here:

#Shapefiles are available here: http://gadm.org/
#select France, R -SpatialPolygon and Level 2 data

#load the libraries
library(plyr)
library(stringr)
library(reshape2)
library(tidyverse)
library(sp)
library(rgdal)
library(viridis)

#set working directory
setwd("Desktop/Blog/Election/")
#list files
li<-list.files(pattern="cdsp") #loop through the files and format them dat%     mutate(Abstention=(Inscrits-Votants)+Blancs)%>%
    rename(Dep_ID=`Code département`)%>%
    select(-(5:7))%>%
    gather(Candidats,Nombre,-(Dep_ID:Inscrits),-Year)%>%
    group_by(Dep_ID,Candidats,Year)%>%
    summarise(Nombre=sum(Nombre),Inscrits=sum(Inscrits))%>%
    mutate(Prop=Nombre/Inscrits)->tmp2
  tmp2$Candidats<-gsub(" \\(.*$","",tmp2$Candidats)
  tmp2$Dep_ID<-str_pad(tmp2$Dep_ID,2,side="left",pad="0")
  dat<-rbind(dat,tmp2)
}
#put candidate names in small caps
dat$Candidats<-str_to_title(dat$Candidats)
#correct one candidate name
dat$Candidats[grep("Villier",dat$Candidats)]<-"de Villiers"
#add the general political movement of each candidate
cand_list<-read.table("courant.csv",sep=",",header = TRUE,stringsAsFactors = FALSE)
#merge with the data
dat2<-merge(dat,cand_list,by.x=c("Candidats","Year"),by.y=c("Name","Year")) #get total number of potential voters per year dat2%>%
  filter(Candidats=="Abstention")%>%
  group_by(Year)%>%
  summarise(Tot_inscrit=sum(Inscrits))->tot_inscrit


dat2%>%
  group_by(Year,Courant)%>%
  summarise(Nombre=sum(Nombre))%>%
  left_join(tot_inscrit,by="Year")%>%
  mutate(Prop=Nombre/Tot_inscrit)->dat_time

col_courant<-c("#333300","#ff9900","#99ccff","#ff99ff","#0000ff","#33cc33","#001a33","#ff0000","#ff6666")#choose better colors
#plot per movement
ggplot(dat_time,aes(x=Year,y=Prop,color=Courant))+geom_path(size=1.5)+
  scale_color_manual(values=col_courant)+labs(y="Proportion of voters")


#load shapefile
fr<-readRDS("FRA_adm2.rds")

#re-arrange data for interation by courant into the polygon dataframe
dat2$Courant<-gsub(" ","_",dat2$Courant)
dat3<-dcast(dat2,formula = Dep_ID~Courant+Year,value.var = "Prop",fun.aggregate = sum)
#merge to the spatial data
fr2<-merge(fr,dat3,by.x="CCA_2",by.y="Dep_ID")
#plot the spatial patterns of abstention over the years
spplot(fr2,zcol=paste("Abstention",c(1965,1969,1974,1981,1988,1995,2002,2007,2012),sep="_"),col.regions=rev(viridis(100)),col="white",
       names.attr=c("1965","1969","1974","1981","1988","1995","2002","2007","2012"),main="Proportion of Abstention")
#plot the spatial patterns of far right vote over the years
spplot(fr2,zcol=paste("Extreme_Droite",c(1965,1974,1988,1995,2002,2007,2012),sep="_"),col.regions=rev(inferno(100)),col="white",
       names.attr=c("1965","1974","1988","1995","2002","2007","2012"),main="Proportion of vote for the Far Right")

#look at temporal patterns per regions and focusing on the main courant
dat2<-merge(dat2,fr@data[,c("NAME_1","NAME_2","CCA_2")],by.x="Dep_ID",by.y="CCA_2") #first get per region and year the total number of potential voter dat2%>%
  filter(Candidats=="Abstention")%>%
  group_by(Year,NAME_1)%>%
  summarise(Tot_inscrit=sum(Inscrits))->tot_inscrit_reg
#then add this to the data and compute the proportions
dat2%>%
  group_by(Year,NAME_1,Courant)%>%
  summarise(Nombre=sum(Nombre))%>%
  left_join(tot_inscrit_reg,by=c("Year","NAME_1"))%>%
  mutate(Prop=Nombre/Tot_inscrit)%>%
  filter(Courant%in%c("Abstention","Centriste","Droite","Extreme_Droite","Socialiste"))->dat_reg
dat_reg$NAME_1<-gsub("-","-\n",dat_reg$NAME_1)
#ggplot2 thene
theme_el<-theme(legend.position = "bottom",panel.background = element_rect(fill="white",color=NA),
                panel.grid.major.y = element_line(linetype="dashed",color="black"),
                panel.border=element_rect(color="black",fill=NA),axis.text.x=element_text(size=7),
                strip.background = element_rect(fill = "grey85",colour = "grey20"), legend.key = element_rect(fill = "white",colour = NA))
#the plot
ggplot(dat_reg,aes(x=Year,y=Prop,color=Courant))+
  geom_path(size=2)+facet_grid(Courant~NAME_1)+
  scale_x_continuous(breaks=c(1970,1990,2010))+
  theme_el

Leave a Comment